
Welcome to the Data Visualization subject guide.
This page serves as a guide to to help you find Data Visualization resources that are available through the Leatherby Libraries.
Data visualization is a broad topic that can range from communicating scientific findings through figures in a paper, creating engaging interactive plots for longform journalism published on the web, or preparing a dashboard for business stakeholders. Despite the different goals, data types, and publication formats, the principles of great data visualization remain the same. Data visualization, like writing, is a communication skill that everyone can both benefit from and improve on.
This guide is divided into several sections with links to library and open non-library resources to help you master communicating data effectively and efficiently. It is not exhaustive, and not intended to replace exploring the concepts presented here in more depth on your own according to your interests and needs.
Data visualization supports a different kind of understanding than looking at a page of raw data, especially for viewers who may not be subject experts. Visualizing can help you emphasize a point, allow viewers to explore data they couldn't in its raw form, or make surprising connections. Visualizing your data may help:
It may be the only thing someone remembers after a presentation. Additionally, visualizing your data as a step in data evaluation or analysis can help you see patterns that you don't get from summary statistics!
Visualization, then, is a highly valuable tool for anyone communicating or analyzing data. There are as many different types of graphs and plots as there are use cases for visualization.
Anscombe's Quartet and the Datasaurus
These are two famous examples of datasets having the same summary statistics but very different visualizations. Anscombe's Quartet was created to show the effects of outliers and the importance of plotting your data when analyzing it. The descriptive statistics for each dataset are the same, within 2 decimal places, yet the plots look completely different.
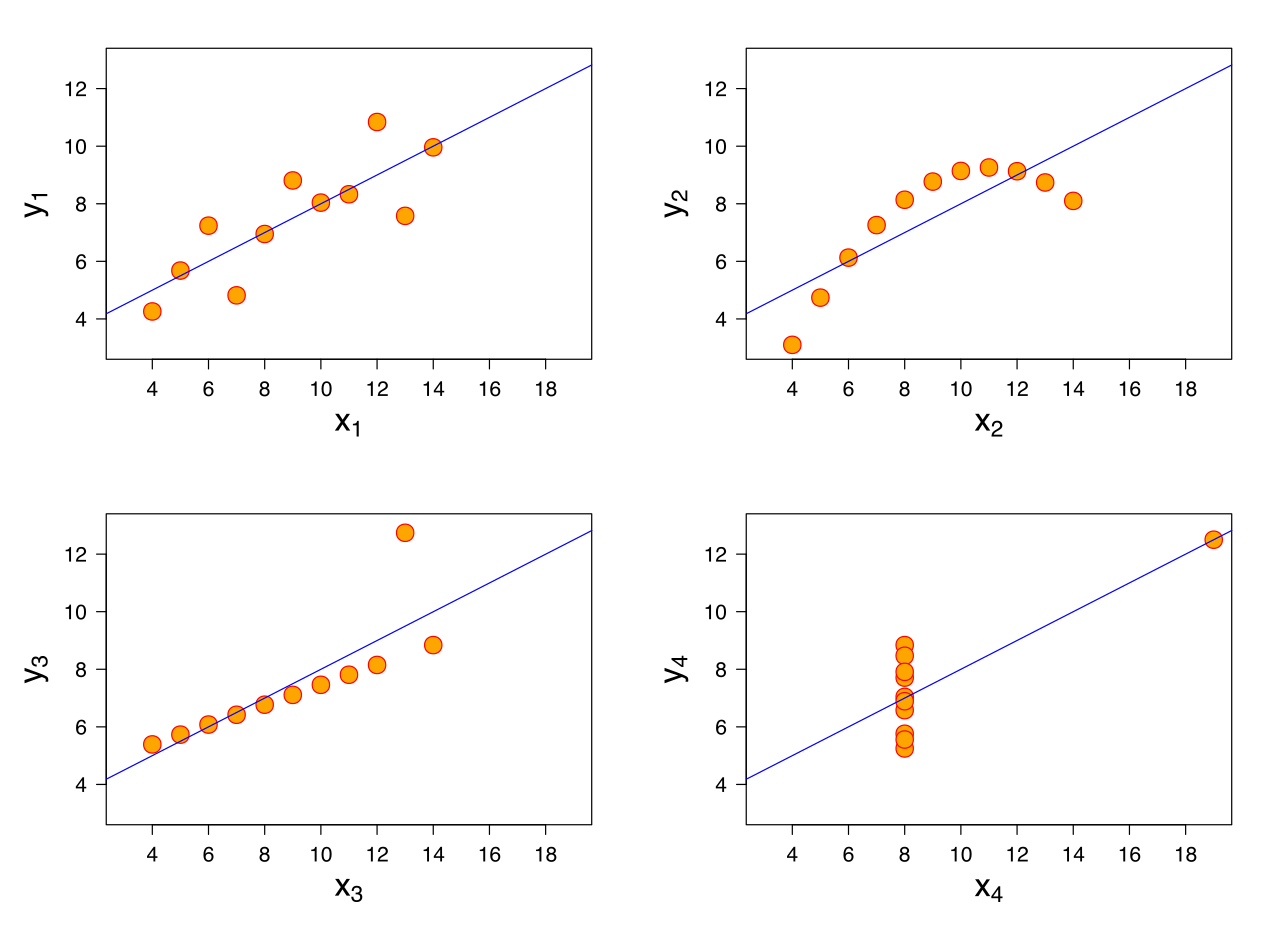
Image from Wikimedia Commons - CC BY SA
The Datasaurus dozen collection of datasets is a modern equivalent of Anscombe's quartet, created by Alberto Cairo in 2016. It extends and exaggerates the point made by Anscombe by first using a tool called DrawMyData to create a plot of a T-rex, and then providing 12 alternative datasets that again have the same descriptive statistics but wildly different plots.
These two collections of datasets and plots demonstrate the most obvious reason to visualize your data - by seeing the data plotted, you may notice patterns, outliers, or other important aspects that could be missed with descriptive statistics alone.
Storytelling with data
Your interest in visualization may be in service of communication, in scientific, business, or journalistic contexts. Visualization is a powerful tool for helping people grasp the point of the data you have, and considering the story you want to tell is one of the earliest steps in the data visualization design process (discussed on another page of this guide). There are resources for all of the previously-mentioned contexts and more available either openly on the web or through the Leatherby Libraries.
This work is licensed under a Creative Commons Attribution 4.0 International license.

Works excluded from this license include but are not necessarily limited to the following:
The language of this disclaimer has been borrowed from the UConn CC guide.